
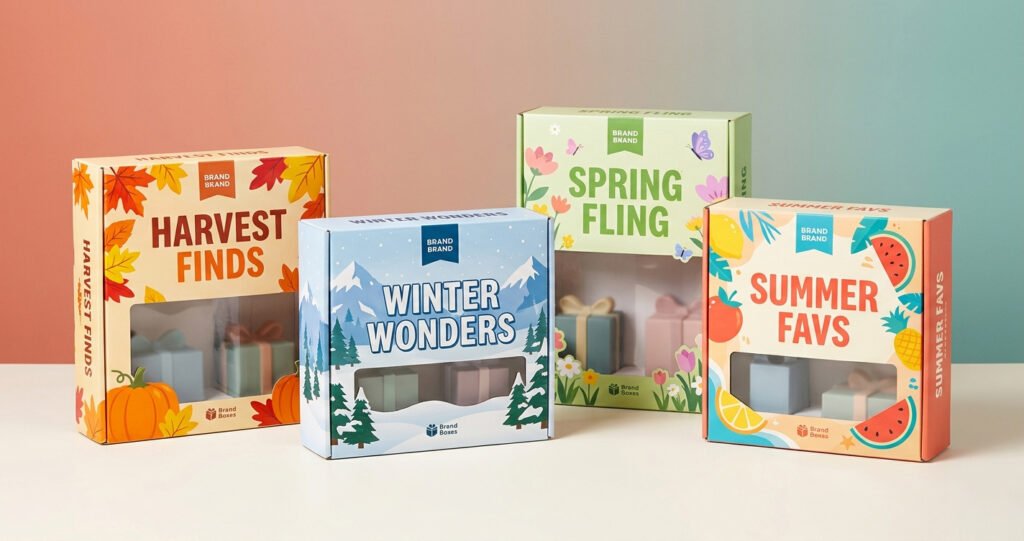
Brands running seasonal campaigns with custom printed display boxes discover that managing multiple concurrent designs creates inventory problems that eclipse the marketing benefits. A snack brand launches four seasonal display box designs for Q4 simultaneously, then finds 2,400 units of Halloween design still in warehouse storage when Christmas inventory arrives, tying up $3,600 in unusable packaging while the new design sits in production.
Meanwhile, a beauty brand ordering Valentine’s Day display boxes in January discovers their supplier’s peak season capacity pushes delivery to February 16th, missing the selling window entirely. Neither problem originates from poor design decisions. Both result from treating seasonal display box campaigns as isolated orders rather than coordinated inventory systems.
This guide explains how brands manage multiple seasonal custom printed display box designs without inventory chaos, production sequencing strategies preventing stockouts and overruns, design frameworks reducing per-cycle costs, and operational systems enabling seasonal variety without warehouse complexity.
Why Seasonal Display Box Campaigns Create Inventory Problems
The Forecast Confidence Gap
Seasonal display box campaigns require committing to production quantities 16-20 weeks before the sell window opens. This timing gap creates forecast uncertainty brands consistently underestimate.
A product that sold 800 units in Halloween display boxes last year doesn’t automatically sell 800 this year. Category competition shifts, retailer planogram changes, and consumer demand variations create sell-through variance of 20-40% year-over-year for most seasonal products.
Brands ordering conservatively to prevent obsolescence risk stockouts during peak selling periods. Brands ordering aggressively to capture full demand risk carrying obsolete inventory when the season closes. Neither approach works without structured forecasting methodology.
The inventory problem compounds across multiple seasonal designs running concurrently. A brand managing six seasonal custom printed display box designs simultaneously faces six independent forecast uncertainties. One overrun per cycle typically costs $2,000-5,000 in unusable inventory, making annual obsolescence costs $12,000-30,000 for brands without systematic planning.
Peak Season Production Capacity Constraints
Supplier capacity during peak production windows creates lead time extensions that compress available ordering timelines. Understanding when capacity tightens determines realistic ordering deadlines for each seasonal design.
Q3 and Q4 represent maximum demand periods for custom printed display box production. Suppliers booking holiday production begin filling capacity in July and August. Brands ordering Halloween and Christmas designs in September discover 12-16 week lead times rather than standard 8-10 business days.
Multiple concurrent seasonal designs from the same brand amplify capacity challenges. A brand placing four seasonal orders simultaneously competes internally for supplier capacity, potentially pushing some designs past their viable production windows.
Production capacity constraints affect small and large brands differently. Established accounts with volume commitments receive priority allocation while newer accounts face longer queues or full capacity rejections during peak periods.
Multiple SKU Warehouse Complexity
Each distinct seasonal design represents a separate inventory SKU requiring individual tracking, storage allocation, and rotation management. Managing six seasonal display box designs means maintaining six separate stock levels, expiration tracking systems, and reorder triggers.
Warehouse staff picking seasonal display boxes must correctly identify and select the appropriate design without mixing inventory. Identical structural dimensions across seasonal designs create mis-pick risks when boxes differ only in print. Receiving 500 Valentine’s Day boxes mixed with 300 Christmas boxes creates fulfillment errors discovered only when wrong-season packaging reaches customers.
Storage space requirements multiply with seasonal variety. A brand maintaining safety stock for six seasonal designs simultaneously occupies 6x the warehouse footprint of a brand running a single evergreen design. This footprint has real cost implications particularly for brands using third-party fulfillment warehouses charging per-pallet storage fees.
Obsolescence tracking across multiple seasonal designs creates administrative overhead. Finance teams must monitor which designs are approaching their sell window close, calculate write-off costs for remaining units, and adjust future order quantities based on actual sell-through data.
How Does Base Structure Strategy Reduce Seasonal Costs?
One Die, Multiple Printed Variations
The most effective cost reduction strategy for seasonal custom printed display box campaigns uses a single structural die cut across all seasonal variations, changing only printed graphics between cycles.
Structural die creation for a custom display box costs $800-2,500 depending on complexity. Running four seasonal designs with independent structural dies creates $3,200-10,000 in tooling investment. Using one structural die with four printed variations reduces tooling cost to $800-2,500 total, a 75% reduction on tooling alone.
This approach requires designing seasonal visual systems around a fixed structural template. Graphics, colors, typography, and seasonal imagery all change. Box dimensions, panel layout, flap configuration, and window positioning remain constant across all seasonal variations.
The structural consistency creates additional operational benefits beyond cost. Warehouse staff recognize identical box structures improving pick accuracy. Assembly line setup remains consistent across seasons eliminating retraining costs. Display unit footprint in retail environments stays uniform preventing planogram conflicts when designs rotate.
Modular Design Architecture
Modular design architecture creates a seasonal visual system with consistent brand framework elements and interchangeable seasonal graphic components. This approach accelerates the design cycle for each new seasonal variation while maintaining recognizable brand identity.
Consistent brand elements occupying fixed panel positions (logo placement, brand color blocking, typography hierarchy) across all seasonal designs create instant brand recognition regardless of season. Interchangeable seasonal elements (holiday imagery, color palette shifts, seasonal messaging) occupy predefined zones within the fixed structure.
Design production time for each subsequent seasonal variation drops 40-60% when modular architecture exists. Designers work within established structural constraints rather than rebuilding layouts from scratch. Brand managers approve familiar frameworks with seasonal updates rather than evaluating entirely new designs.
Print setup costs reduce with modular systems since Pantone color targets and substrate specifications carry forward between seasonal variations. Only the variable graphic elements require new press setup reducing make-ready time and cost.
Material and Finish Consistency
Using identical board grade, lamination, and finish specification across seasonal variations eliminates material changeover costs and simplifies reordering. A seasonal campaign where every design uses 18pt SBS with matte lamination and spot UV maintains consistent production parameters reducing supplier setup time.
Material consistency also simplifies quality control. Inspectors comparing output against a known material standard catch deviations more reliably than inspectors shifting between different substrate and finish combinations.
Finish specification affects cost significantly. If summer and holiday designs both use matte lamination with spot UV, combining production runs reduces setup costs. If each seasonal design uses a different finish specification, each requires independent setup eliminating opportunity to batch similar work.
What Quantity Calculation Framework Prevents Overruns?
Sell-Through Rate Analysis by Season
Historical sell-through data provides the most reliable quantity forecasting foundation. Sell-through rate measures percentage of inventory sold within the intended seasonal window, revealing how accurately previous forecasts matched actual demand.
Calculating sell-through rate: (units sold within window / units ordered) × 100. A Halloween campaign ordering 1,000 display boxes and selling 820 before October 31 achieves 82% sell-through, leaving 180 units for write-off. Target sell-through rates by season: date-specific holidays (Valentine’s, Halloween, Christmas) should target 92-96% sell-through. General seasonal (summer, spring) can target 85-90% sell-through given extended windows.
Brands without historical data should start conservatively. First-season orders at 60-70% of theoretical demand capacity create intentional stockout risk but protect against catastrophic obsolescence. Second-season orders adjust based on actual sell-through data with confidence increasing each cycle.
Multi-year trend analysis reveals seasonality patterns. A product growing 25% year-over-year applies growth factor to previous seasonal sell-through data. A product with stable sales applies flat projections. Declining products apply reduction factors preventing over-investment in seasonal inventory.
Tiered Quantity Planning by Obsolescence Risk
Seasonal designs carry different obsolescence risk profiles requiring different safety stock approaches. Date-specific holidays (Valentine’s Day, Halloween, Christmas) have hard expiration dates when packaging becomes completely unusable. General seasonal designs (summer, spring) have soft expiration dates when designs become visually dated but could theoretically sell through.
Date-specific holiday designs require tighter quantity discipline. Ordering 5-8% above sell-through forecast limits downside exposure while covering normal demand variance. Ordering 20% above forecast for Halloween creates significant write-off risk from 200 surplus units at $0.85-1.50 per box.
General seasonal designs tolerate slightly more generous safety stock since unsold inventory can either sell at season close or transition into next year’s campaign if designs remain relevant. Summer display box designs ordered 12-15% above forecast create manageable exposure versus the same practice for date-specific holidays.
New designs in first season warrant conservative quantities regardless of category. Established designs with 3+ years of sell-through data support more aggressive safety stock given higher forecast confidence.
Retailer and Channel-Specific Quantity Planning
Retail channel characteristics significantly affect appropriate seasonal display box quantities. Direct-to-consumer e-commerce brands control their own display environment enabling flexible inventory management. Retail wholesale brands ordering display boxes for placement in specific retail chains face planogram commitments driving minimum quantity requirements.
Retailer-required display box quantities for planogram compliance often exceed optimal inventory levels. A retailer requiring 12 units of filled display boxes per store across 50 locations mandates 600 display boxes minimum regardless of sell-through forecast. Brands must evaluate whether retailer placement value justifies potentially carrying 20-30% more inventory than sell-through analysis recommends.
Channel mix planning allocates seasonal display box quantities across direct and wholesale channels. If 40% of seasonal sales occur through retail wholesale and 60% through direct e-commerce, quantity planning weighted toward retail commitments prevents e-commerce stockout while managing total obsolescence exposure.
How Should Seasonal Production Be Sequenced?
Annual Production Calendar Development
Building an annual production calendar mapping every seasonal design from order placement through sell window close creates visibility preventing last-minute production crises. This calendar serves as the single planning document coordinating design, production, shipping, and sell-through tracking.
Annual calendar development starts with identifying every seasonal campaign planned for the coming year including approximate sell window dates. Working backwards from each sell window open date using actual lead times (not supplier minimums) determines order placement deadlines.
Key calendar milestones for each seasonal design: order placement deadline, artwork finalization deadline, proof approval deadline, production completion date, shipping window, sell window open date, sell window close date, and obsolescence review date.
Artwork finalization deadlines typically fall 2-3 weeks before order placement allowing design development and revision cycles without compressing production timelines. Brands consistently missing artwork deadlines push order placement dates past capacity booking windows, triggering peak season surcharges or missed production slots.
Staggered Production Scheduling
Running all seasonal designs through production simultaneously during peak periods creates supplier capacity conflicts. Staggered production scheduling sequences designs through production windows based on sell window priority, quantity size, and supplier capacity availability.
Designs with earlier sell windows enter production first. Christmas packaging entering production in August occupies capacity before Halloween packaging entering in July, creating conflict. Staggering by reversing this sequence (Halloween first, Christmas second) aligns production with sell window sequence.
Volume sequencing considers that large-quantity orders occupy more supplier capacity time. If summer designs require 5,000 units and Valentine’s designs require 1,500 units, scheduling the larger summer run during off-peak capacity windows (Q1) and the smaller Valentine’s run during moderate periods optimizes both cost and availability.
Supplier advance communication about annual production plans enables capacity reservation before formal orders. Informing suppliers in January about Q3 and Q4 volume expectations allows them to reserve capacity months ahead of formal orders preventing peak-season availability conflicts.
Design Transition Management
Managing the transition between sequential seasonal designs prevents inventory overlap creating mixed-SKU storage problems. Clear transition protocols specify exactly when old seasonal inventory should be depleted before new seasonal inventory arrives.
Hard transition dates for date-specific holiday designs require all previous season inventory depleted before new season inventory arrives. Valentine’s Day boxes must clear warehouse before Easter inventory ships. This requires accurate sell-through forecasting ensuring zero carryover inventory rather than managing mixed holiday seasons simultaneously.
Soft transition designs with overlapping sell windows (spring into summer) require SKU segregation preventing order fulfillment errors. Color-coded bin locations, separate pallet positions, and clear labeling distinguish designs with similar structures but different seasonal graphics.
Sell-through acceleration tactics for designs approaching window close include promotional pricing, bundled offers, or retailer markdown support reducing remaining inventory. Clearing 95% of seasonal inventory by window close generates proceeds offsetting disposal or write-off costs from remaining units.
What Are the True Costs of Seasonal Inventory Mismanagement?
Obsolescence Write-Off Calculations
Obsolescence cost calculation includes material cost plus allocated overhead for production, shipping, and storage of unusable inventory. A custom printed display box costing $0.85-1.50 per unit generates $0.85-1.50 write-off per obsolete unit plus $0.15-0.30 allocated overhead for units that never generated revenue.
Example write-off calculation for a Halloween campaign with 15% overrun: 1,000 units ordered × 15% surplus = 150 unusable units × $1.20 average unit cost + $0.20 overhead = $210 direct write-off. Multiply across six seasonal designs with similar overrun rates: $1,260 annual write-off minimum from obsolescence alone.
Brands writing off seasonal inventory also absorb the opportunity cost of capital tied in unusable materials. $1,260 invested in surplus seasonal boxes could fund 840-2,500 units of evergreen packaging generating ongoing revenue rather than write-off expense.
Emergency Production Premiums
Stockout scenarios from under-ordering seasonal designs create emergency production costs that typically exceed obsolescence write-off costs from moderate overruns. Rush production premiums add 20-50% to standard production costs. A 1,000-unit seasonal design costing $1,200 standard production costs $1,440-1,800 on rush.
Stockout sales losses during peak seasonal windows often exceed emergency production costs. A product generating $8,000 weekly during peak Halloween selling encountering one-week stockout from packaging delay loses more revenue than the $600 rush production premium would have cost.
Retailer relationship damage from seasonal stockout creates longer-term costs beyond the immediate lost sales window. Retailers experiencing packaging-related stockouts from a supplier reduce confidence in future seasonal commitments, potentially affecting planogram allocation for subsequent seasonal campaigns.
Storage Cost Accumulation
Unsold seasonal inventory occupying warehouse space between campaigns generates ongoing storage costs eliminating any savings from conservative ordering. Third-party fulfillment warehouses typically charge $15-35 per pallet per month. A pallet of 500 display boxes stored three months past its sell window close costs $45-105 in pure storage before write-off.
Climate-controlled storage adds premium costs for display boxes requiring protection from humidity or temperature extremes. Display boxes stored improperly accumulate print degradation, warping, and corner damage reducing their value even when technical shelf life remains.
Internal warehouse opportunity cost from seasonal inventory holding space that could house active inventory or fulfillment operations. Brands with limited warehouse capacity face particularly acute tradeoffs between seasonal inventory depth and operational efficiency.
How Do Digital Printing Economics Affect Seasonal Strategy?
Small Seasonal Run Economics
Digital printing enables seasonal display box orders starting at 250-500 units, making low-volume seasonal experimentation economically viable. Per-unit costs at these quantities run $1.20-2.50 versus $0.65-1.10 at offset printing minimum quantities (2,500-5,000 units).
The economic calculation for small seasonal runs compares per-unit premium against obsolescence risk reduction. A Valentine’s Day campaign ordering 400 units at $1.80 per box ($720 total) versus 2,500 units at $0.90 per box ($2,250 total) creates a $1,530 cost difference. If sell-through history suggests 400 units is the realistic demand ceiling, the digital premium prevents $1,890 in surplus inventory write-off at the lower quantity.
Digital printing turnaround (3-5 business days production versus 8-10 for offset) enables closer-to-season ordering reducing forecast uncertainty. Ordering 6 weeks before sell window open rather than 16-20 weeks provides substantially more accurate demand data reducing over and under-ordering risk.
Hybrid Volume Strategy
Hybrid production strategies combine offset printing for core seasonal inventory with digital printing for demand surge capacity. Ordering 70% of forecast demand via offset at lower per-unit cost, then digitally printing additional units if actual demand tracks above forecast, captures offset economics while maintaining flexibility.
This approach requires supplier relationships with both offset and digital capability, or two supplier relationships managed in parallel. Coordination complexity increases but the economic benefit justifies this overhead for brands with seasonal volumes above 2,000 units where offset economics provide meaningful savings.
Pre-negotiating digital surge capacity with suppliers before seasonal windows ensures availability during peak demand. Suppliers confirming digital capacity for potential surge orders before the season opens prevent discovery of unavailable capacity when demand tracking requires quick response.
When Offset Remains the Better Choice
Offset printing maintains economic advantage for seasonal campaigns with high forecast confidence and volumes above 2,500 units. Brands with 5+ years of sell-through data showing consistent seasonal demand within 10% year-over-year variance can confidently order offset minimums without excessive obsolescence risk.
Finishes available only through offset or flexographic processes (certain metallic inks, specialty coatings, specific lamination options) require offset regardless of quantity economics. Brands where seasonal design requires specific finish capabilities must plan offset production regardless of volume.
Long shelf-life seasonal designs without hard expiration dates suit offset economics more comfortably than date-specific holiday designs. A general autumn theme display box remains usable from September through December allowing wider sell window and higher sell-through probability at offset quantities.
Common Seasonal Campaign Management Mistakes
Treating Each Season as Independent
Managing seasonal display box campaigns as separate independent projects prevents learning from previous cycles. Systematic sell-through tracking creating annual data archives improves forecast accuracy each cycle, reducing both stockout and obsolescence risk progressively.
Brands without centralized seasonal planning often duplicate supplier negotiation, miss combined volume discounts from batching seasonal orders, and create unnecessary internal coordination overhead managing campaigns that overlap in production timelines.
Missing Artwork Deadlines Consistently
Artwork delays represent the single most controllable cause of missed seasonal production windows. Brands consistently finalizing artwork 2-4 weeks later than planned push order placement past capacity booking windows, paying peak-season surcharges or accepting delayed delivery.
Establishing artwork finalization deadlines with 2-week buffers before order placement deadlines provides contingency for revision cycles without compressing production timelines. Brief design briefs submitted to design teams 8-10 weeks before artwork deadline prevent last-minute creative development collapsing the buffer.
Ignoring Sell-Through Data From Previous Cycles
Ordering seasonal display box quantities based on optimistic sales projections rather than historical sell-through data repeats obsolescence mistakes each cycle. Even imperfect historical data provides better quantity guidance than theoretical demand estimates.
Brands in first or second year of seasonal campaigns should document actual sell-through rates meticulously regardless of how modest the data set. Year three decisions informed by two years of real data outperform continued reliance on estimates.
Over-Designing Each Seasonal Variation
Investing in unique structural dies for every seasonal design eliminates the tooling cost benefits of base structure strategy. Brands approving new structures for each seasonal variation because designs “feel different” pay $800-2,500 per cycle in avoidable tooling costs.
Structural consistency disciplines the design team to work within proven frameworks. This constraint often improves design quality by focusing creative energy on graphic execution within an established structure rather than structural novelty.
Underestimating Peak Season Lead Times
Ordering seasonal display boxes using standard lead time assumptions during peak production periods creates delivery failures. Peak season capacity constraints extend timelines 3-5 weeks beyond standard production windows. Treating August through October as normal production months when ordering Q4 seasonal designs guarantees late delivery.
Confirming current lead times directly with suppliers before placing seasonal orders rather than assuming standard timelines prevents schedule surprises. A single confirmation call 12-16 weeks before needed delivery prevents the most common cause of seasonal stockout.
Practical Implementation for Annual Seasonal Campaigns
Building the Seasonal Planning System
Dedicate one planning session annually in Q4 mapping the complete following year seasonal display box calendar. This session identifies all planned seasonal designs, assigns order placement deadlines based on confirmed supplier lead times, allocates production budgets, and establishes sell-through targets per design.
Distribute the completed calendar to design teams, operations, warehouse managers, and finance. Visibility across functions prevents the common scenario where design delays in one department cascade into missed production windows managed by operations teams.
Review the seasonal calendar quarterly adjusting for product line changes, retailer commitment updates, and sell-through data informing quantity projections for upcoming designs.
Establishing Supplier Relationships Supporting Seasonal Variety
Maintain ongoing communication with your primary display box supplier throughout the year rather than contacting only when orders are ready. Quarterly updates about seasonal campaign plans enable suppliers to reserve capacity, manage material procurement, and flag potential timeline conflicts before they become production emergencies.
Discuss base structure strategy with suppliers during annual planning. Suppliers often suggest structural modifications reducing tooling costs or improving production efficiency that brand teams unaware of manufacturing constraints would never identify independently.
Establish payment terms supporting seasonal cash flow requirements. Seasonal campaigns create lumpy cash flow with large production payments preceding revenue generation by 4-8 weeks. Flexible payment terms negotiated in advance prevent cash flow constraints forcing quantity reductions at order placement.
Measuring Seasonal Campaign Performance
Track four metrics per seasonal display box campaign: sell-through rate (units sold within window / units ordered), obsolescence rate (units written off / units ordered), stockout events (number of days out of stock during sell window), and production variance (actual delivery date versus planned delivery date).
These four metrics together provide complete picture of seasonal campaign performance. A campaign with 94% sell-through, 2% obsolescence, zero stockout events, and on-time delivery represents excellent execution. A campaign with 85% sell-through, 10% obsolescence, three stockout days, and one-week late delivery identifies specific improvement opportunities for the following cycle.
Annual review aggregating seasonal campaign metrics across all designs reveals systemic patterns. Consistently high obsolescence rates across multiple campaigns signal forecast methodology requiring revision. Consistent production variance identifies supplier relationship or ordering process issues rather than isolated incidents.
Final Thoughts
Custom printed display box seasonal campaigns fail not from poor design decisions but from inadequate inventory and production planning systems. Managing multiple seasonal designs without chaos requires a base structure strategy using one die across all variations reducing tooling costs 40-60%, an annual production calendar with order placement deadlines 16-20 weeks ahead of sell windows, and quantity calculation frameworks matching historical sell-through data to realistic order volumes.
Digital printing enables low-volume seasonal experimentation at 250-500 units, reducing obsolescence risk for new seasonal designs or categories with unpredictable demand. Offset printing remains cost-effective for established campaigns with 5+ years of sell-through data and consistent volumes above 2,500 units. Hybrid strategies combining both methods optimize per-unit economics while maintaining demand flexibility.
The most important operational change for brands currently experiencing seasonal inventory chaos is building the annual planning calendar before the year begins rather than managing each seasonal campaign reactively. One planning session in Q4 mapping the complete following year campaign sequence eliminates the majority of peak-season capacity conflicts, artwork deadline misses, and lead time surprises that create preventable stockouts and overruns.
Aly Packaging USA works with brands running single seasonal designs and full six-season annual campaigns. Low-quantity runs start from 250 units with 8-10 business day standard turnaround. To discuss your seasonal display box calendar and get structural recommendations reducing per-cycle tooling costs, call 1-844-259-7225 or email sales@alypackaging.com.